If line balancing data is messy, the model will miss the floor. This article shows how I’d build an Azure setup that pulls machine, MES, ERP, and operator data into one traceable flow, uses that data to test task moves and staffing changes, and sends approved actions into Teams, Outlook, Power BI, and plant systems.
Here’s the core idea in plain English:
- I start with data quality, not the model.
- I connect PLC/machine signals, MES, ERP, quality logs, and operator inputs.
- I clean station IDs, timestamps, cycle times, downtime labels, and shift calendars so all systems speak the same language.
- I train a model to check takt time, station load, bottlenecks, task order, labor skills, and machine limits.
- I test scenarios like +10% demand, machine downtime, or fewer operators before anyone changes the line.
- I expose results through secure APIs, Power BI, and Microsoft 365 approvals.
- I keep every recommendation and decision logged for audit and plant review.
A few numbers stand out:
- One cited data program moved critical field quality from 68% to 97.2%.
- One cited deployment cut analysis time from weeks to hours.
- In that same case, operator count shifted from 6 to 4 after task and station analysis.
- Power Automate run history is only about 28 days by default, so long-term audit storage has to live elsewhere.
If I had to boil the article down even more, it comes to five parts:
- Ingest and clean plant data
- Train and test a constraint-based balancing model
- Publish recommendations through secure Azure services
- Let supervisors approve changes in tools they already use
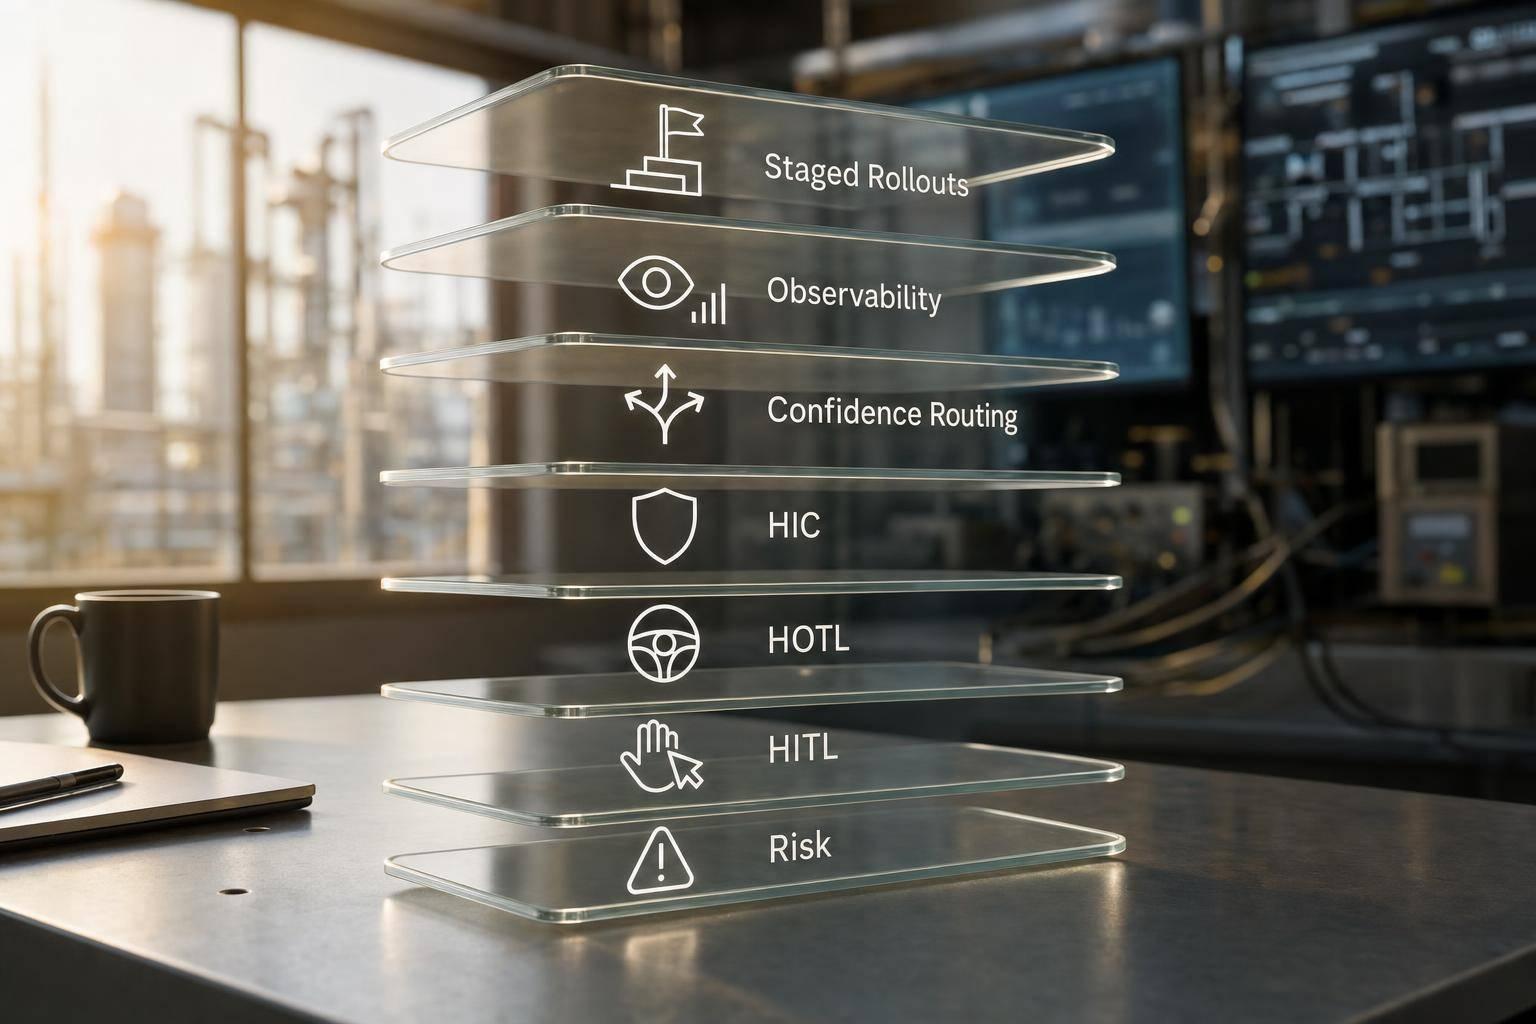
- Keep access, logging, and rollout tightly controlled
The article then walks through that path from pilot line to multi-plant use, with a strong rule throughout: no AI-driven line change should go live without human approval and a clear record of who approved it, when, and why.
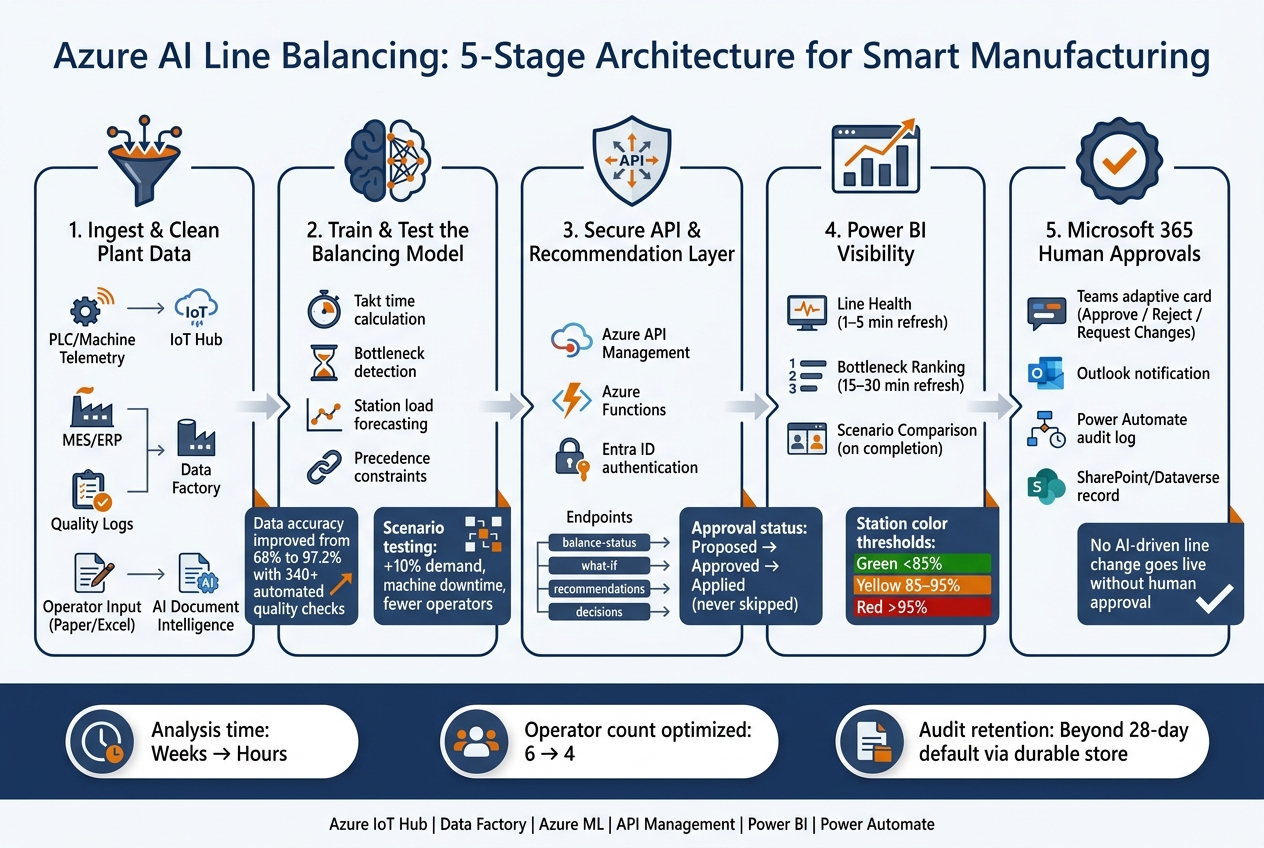
Azure AI Line Balancing: 5-Stage Architecture for Smart Manufacturing
Line Balance: Combine Operations Research and Generative AI techniques to Get Superior Lines
Build the plant data foundation for line balancing
Before any model runs, the data has to be there: clean, connected, and traceable. In many plants, critical field data accuracy starts out lower than people expect. In some cases, it’s only 68% before a formal data foundation effort begins [1]. If the data is off, the model starts from the wrong place. And when that happens, the output looks smart on paper but falls apart on the floor.
Ingest machine, MES, ERP, and operator signals into Azure
The ingestion layer needs to handle two very different kinds of data at once: real-time plant signals and slower business-system records.
High-frequency data like PLC states, machine counts, cycle events, alarms, and microstoppages streams through Azure IoT Hub. Many teams also run Azure IoT Edge on-premises so data can be buffered during network interruptions instead of getting lost.
Slower data from MES, ERP, and other plant systems moves through Azure Data Factory. That includes work orders, demand plans, maintenance logs, shift schedules, and quality records. Azure Data Factory supports batch pulls, change data capture, and file-based imports, which makes it a good fit for systems that don’t send constant event streams.
Raw data should land in Azure Data Lake Storage Gen2 or OneLake, split into Bronze, Silver, and Gold zones. That setup keeps source data intact, which matters when you need to trace a recommendation back to where it came from. Operator inputs such as paper travelers, handwritten logs, and manual reason codes can also be digitized with Azure AI Document Intelligence, using OCR extraction triggered from Blob Storage [1][2].
| Data Source | Azure Component | Ingestion Method |
|---|---|---|
| PLC / Machine Telemetry | IoT Hub / Event Hubs | Streaming / MQTT |
| MES / ERP / Maintenance | Data Factory / Fabric Pipelines | API / CDC / SQL Connector |
| Quality (CMM / Inspection) | Data Factory | CDC / File Import |
| Operator Input (Paper / Excel) | AI Document Intelligence | OCR / Blob Storage Trigger |
Normalize timestamps, cycle times, and station events
Raw ingestion is only half the job. The harder part is getting the data to mean the same thing across systems.
Station IDs, task codes, downtime reason codes, and product family names often vary between MES, ERP, and maintenance tools. Sometimes they describe the same event with different labels. One team logs a stoppage as “microstop.” Another calls it “jam.” One system stores cycle time in seconds, another in minutes. Small mismatches like that can throw off capacity calculations, make bottlenecks look worse than they are, or point the model to the wrong station.
Use one plant-wide time standard. Sync PLCs, MES, ERP, and operator logs to it. Store durations in either seconds or minutes, then stick to that choice across the stack. Shifts, breaks, planned downtime, and changeovers also need to be normalized so the model reads the line the way the plant actually runs.
One aerospace components manufacturer used 340+ automated data-quality checks across seven systems and improved critical field data quality from 68% to 97.2% [1].
Define the data model for balancing decisions
Once the data is clean and lined up, it needs a structure the model can use. For line balancing, the main entities are line, station, product family, routing, task, precedence, skill, capacity, availability, takt, throughput, and downtime.
Each product family should connect to a routing sequence. Each task should include a required skill and an estimated duration. Each station should show capacity and availability limits, including planned downtime and changeover windows.
The labor skill matrix also needs to be explicit. If the model doesn’t know that one operator is certified for stations A and B while another is qualified only for station C, it can suggest a rebalance that looks fine in software but can’t be carried out on the floor. Weak definitions lead to weak recommendations.
With the data model in place, the next move is training and validating the balancing model.
Design and train the Azure AI line balancing model
Once the data model is in place, the next step is training the model that turns station signals into line-balance decisions. That model has to do two things at once: follow fixed line rules and deal with day-to-day operating swings.
Model takt time, bottlenecks, station loading, and precedence constraints
Start with takt time. Calculate it from available shift time and demand, then assign tasks so each station stays within that takt time and task order stays intact. In plain English: you can’t overload a station, and you can’t move a task ahead of one that has to happen first.
The precedence graph shows that task order. Pair that with machine and labor capacity limits, plus changeover requirements, and you have the fixed rules the optimization model must enforce. A supervised model trained on MES and PLC history can then forecast station-level cycle times by product mix and shift. Those forecasts become inputs to the optimizer.
Bottleneck detection runs alongside the forecasting layer. Azure Machine Learning can look at past cycle-time distributions and queue-length signals to flag stations where average cycle time keeps running above takt, or where utilization stays above a set threshold. That signal feeds straight into station-loading decisions.
Use Azure Machine Learning or Azure AI Foundry for training and scenario testing
Set up Azure Machine Learning around versioned datasets, feature sets, and models. Training pipelines can automate the flow from ingestion to feature engineering to model output. At the same time, experiment tracking logs each run’s parameters, including line ID, date range, feature set version, takt targets, and headcount constraints, along with business metrics like predicted units per hour and estimated overtime cost in USD per week.
Scenario testing is where this gets practical for plant leaders. Parameterize inputs such as:
- staffing per station
- shift patterns
- product mix
- machine availability
- takt time
Then run cases like a baseline plan, +10% demand, or two fewer operators on first shift. Score each scenario on throughput, utilization, overtime, and line balance.
Azure AI Foundry can help manage these runs across development, test, and production, so model versions stay aligned and results can be compared across plants. Use the same scenarios for both technical validation and supervisor review. That keeps everyone looking at the same set of tradeoffs instead of arguing over different assumptions.
Validate recommendations before plant use
Offline validation starts with back-testing. Apply recommended station assignments to past periods stored in Azure, then simulate what throughput, WIP levels, and overtime costs would have looked like.
After that, run edge-case testing. Introduce conditions like extreme absenteeism, unexpected machine failures, and sharp demand shifts to see whether the line stays inside acceptable performance bands under stress. This is where weak spots tend to show up fast.
Before any recommendation moves into a live trial, validate it against agreed throughput, overtime, and quality targets. Once the model passes pilot tests, move approved recommendations into the API and workflow layer.
Expose recommendations through APIs, Power BI, and Microsoft 365 workflows
After the model clears validation, expose only approved recommendations inside plant workflows. The goal is simple: turn validated model output into supervisor action, with review, approval, and logging in place before anything changes on the floor.
Create a secure API and approval layer for plant changes
Put the line-balancing model behind Azure API Management and route requests to Azure Functions or Azure App Service. That setup gives you a stable URL, centralized authentication, throttling, and logging, without exposing the model itself. Use Entra ID for authentication instead of static API keys, and use managed identities for service-to-service calls [6][7][8].
Only back-tested recommendations should enter the approval flow. In practice, four endpoints handle the full decision loop:
GET /line/{lineId}/balance-status- returns current takt time, station utilization, queue length, bottleneck stations, and imbalance score. Use Azure Cache for Redis to support low-latency reads on frequently accessed lines [6][7][8].POST /line/{lineId}/what-if- accepts staffing, shift, and task reassignment inputs, then returns simulated throughput, utilization, and risk flags [6][7][8].GET /line/{lineId}/recommendations/current- returns ordered recommended changes along with rationale fields [6][7][8].POST /line/{lineId}/decisions- accepts approved recommendation IDs, supervisor identity, and approval timestamp, writes an audit entry, and fans out events through Azure Service Bus or Event Grid to downstream systems [6][7][8].
Each recommendation needs an approvalStatus field: proposed, approved, rejected, or applied. A recommendation must never move from proposed to applied unless a supervisor approval has been recorded through the Microsoft 365 workflow [9][10][11]. For safety- or quality-critical stations, require two-person approval from production and quality leads.
Use APIM policies to enforce schema validation and log request and response metadata to Application Insights [6][7]. A governance layer should sit across the flow so policy and observability stay in one place.
Use Power BI for line health, bottlenecks, and scenario comparison
Build one line balancing Power BI app with separate report pages, row-level security scoped to each plant and line, and refresh timing matched to how each view is used on the floor. The Power BI views should show the same recommendation set used by the API and workflow layers.
| Power BI View | Primary User | Key Metrics | Refresh Cadence | Decision Supported |
|---|---|---|---|---|
| Line health | Line supervisors, plant managers | Takt adherence, throughput (units/hour), station utilization %, OEE, exception count per shift | Near real-time (1–5 min) | Whether the line is healthy; which station needs immediate attention this shift |
| Bottleneck ranking | Industrial/process engineers | Station utilization ranking, delay contribution, Pareto of exception causes, cycle time spread | Frequent (15–30 min) | Where to focus improvement work; which constraint to address next |
| Scenario comparison | Engineers, planners | Current vs. proposed throughput, imbalance scores, WIP, bottleneck shifts, risk flags | On scenario completion / hourly | Which scenario to approve; expected impact of task reassignments and staffing changes |
Use a station diagram with color thresholds by utilization: green below 85%, yellow from 85% to 95%, and red above 95%. That makes trouble spots easy to spot at a glance. The scenario comparison view should let supervisors toggle staffing levels or shift patterns and see the projected change in throughput and imbalance score before they approve anything.
Show cost metrics in USD and production rates in units per hour. Add visual alerts when key metrics drift more than 5% from standard so the dashboard does more than report the past; it helps guide action in the moment [12][13][14][15][16].
Route supervisor actions through Teams, Outlook, and Power Automate
When the API publishes a new recommendation set, an Azure Service Bus event can trigger a Power Automate flow. That flow posts an adaptive card in the supervisor’s Teams chat or line channel with the shift summary, proposed changes, expected impact, and risk flags. Keep the action buttons inline: Approve, Reject, and Request Changes. In parallel, send an Outlook email with the same details and a deep link back to the Teams card.
When the supervisor responds, Power Automate should call the decisions API with the recommendation IDs and the supervisor’s Entra ID identity. Store approval time in UTC, then display it in local plant time - for example, 08/30/2026 02:15 PM Central Time. The flow should also write a record to a SharePoint list or Dataverse table with the model output snapshot ID, review notes, final action, approver identity, and any dual approvals.
Power Automate’s native run history is kept for only about 28 days by default, so you need a durable store for a compliance-ready audit trail [3][4][5]. After approval, downstream flows can push configuration changes to the MES or create operator task assignments, then send a confirmation message back to the supervisor in Teams.
Apply the two-person approval rule across the flow: the person who requests a change cannot also approve it. Enforce that rule directly in Power Automate so every AI-triggered action leaves a clear decision trail, with segregation of duties built in from day one. That approval trail then feeds the governance layer in the next section.
Governance, rollout, and conclusion
Apply access control, auditability, and data protection across Azure and Fabric workspaces
Start with Microsoft Entra ID groups mapped to plant roles, then keep access as tight as possible. Industrial engineers should have Contributor or ML Workspace rights in development. Line supervisors should only see data for their own plant and line, enforced with row-level and object-level permissions in Fabric and Power BI. Production changes should stay in the hands of a small central team with Owner or Approver rights.
It also helps to keep Dev, Test, and Prod fully separate in Azure subscriptions or resource groups, with matching Fabric and ML workspaces. In production, use Private Link and managed VNets. Every model moved into production should include metadata tags for model version, training dataset ID, feature schema version, and the approval ticket tied to deployment.
Every recommendation event and every human decision should be written to append-only audit tables with restricted write access. That gives you a clear record of what the model suggested, what a person approved, and when it happened. Encrypt data at rest with Azure Storage Service Encryption and in transit with TLS. Pseudonymize operator identifiers in analytical layers so Power BI only shows aggregated, role-based detail. And because sensitivity labels in Fabric flow into downstream reports and exports, protection stays attached to the data without manual re-tagging [17][18][19].
Quanta can enforce policy between plant apps and model endpoints while keeping append-only audit records [21].
Once those guardrails are in place, test the setup on one line before taking it any further.
Roll out from one line to plant-wide deployment in phases
Begin with a single line, then expand only after shadow-mode results line up with plant performance. The best pilot line usually has stable demand, a product mix that isn’t too chaotic, and supervisors who will stay involved instead of treating the project like someone else’s problem.
Connect machine, MES, ERP, and operator data from that line into Azure. Then run the model in shadow mode. In plain English, the system makes recommendations, but no one acts on them yet. You compare those recommendations with human decisions during the first validation window and check whether the model is making sound calls. Live approvals should wait until recommendation quality is proven.
After the pilot line performs well, add the Teams and Power Automate approval flows and Power BI line-health views. Track takt adherence, throughput, and overtime before and after the rollout so the line-balancing effect shows up in numbers, not just in gut feel. When results settle down, expand to more product families or similar lines in the same plant. At that stage, you can reuse pipeline templates, model setup blueprints, and operating dashboards instead of rebuilding everything from scratch.
When those lines are running well, move to more plants with a standard Azure landing zone, Fabric workspace setup, and governance policies that each site inherits with only light local changes. Plan for a two-week baseline training period per new asset class and a four- to six-week parallel run at each new site before full go-live [20].
Conclusion: The minimum architecture for production line balancing AI
The minimum stack for line-balancing AI comes down to five connected parts: governed ingestion, constraint-aware modeling, secure APIs, Power BI visibility, and Microsoft 365 approvals. Put those pieces together cleanly, and keep human oversight built in from day one for every line-balancing decision.
Ryshe supports manufacturers building this setup through senior-led continuous AI delivery, data foundations, system integrations with existing MES and ERP platforms, workflow automation, and custom AI product builds on Azure. For teams that want governance and observability from day one, Quanta adds centralized policy enforcement and a tamper-evident audit record across every AI-assisted plant decision.
FAQs
How do you start if plant data is inconsistent?
Start with a full data review before you build any AI. Map the systems that hold production, quality, supply chain, and financial data. Also document the know-how your staff uses to fill in the gaps when those systems don’t line up.
Then take stock of the basics: data formats, how often each source updates, and how those systems connect today. Don’t wire up everything on day one. Instead, begin with 2 or 3 high-value sources linked to a critical business question, and give the team time for data reconciliation so the shop floor trusts what the system shows.
What model works best for line balancing?
For line balancing, the best fit is a machine learning model trained on your actual production data, not a one-size-fits-all model. That gives the model a much better shot at learning the line constraints and work patterns that matter on your floor, so it can support decisions tied to throughput and balance.
In Ryshe’s Azure-focused approach, AI readiness starts with clean, governed data. That step matters because the model can only produce line-balancing outputs you can rely on if the data behind it is in good shape.
How do approvals stop unsafe AI-driven line changes?
Approvals help stop unsafe AI-driven line changes by putting proposed changes behind human review and sign-off. That way, exceptions get surfaced for people to check instead of going live on their own.
Governance controls also help keep bad or untrusted inputs from steering decisions. This includes access permissions, data cataloging and lineage, data quality monitoring, and exception routing.