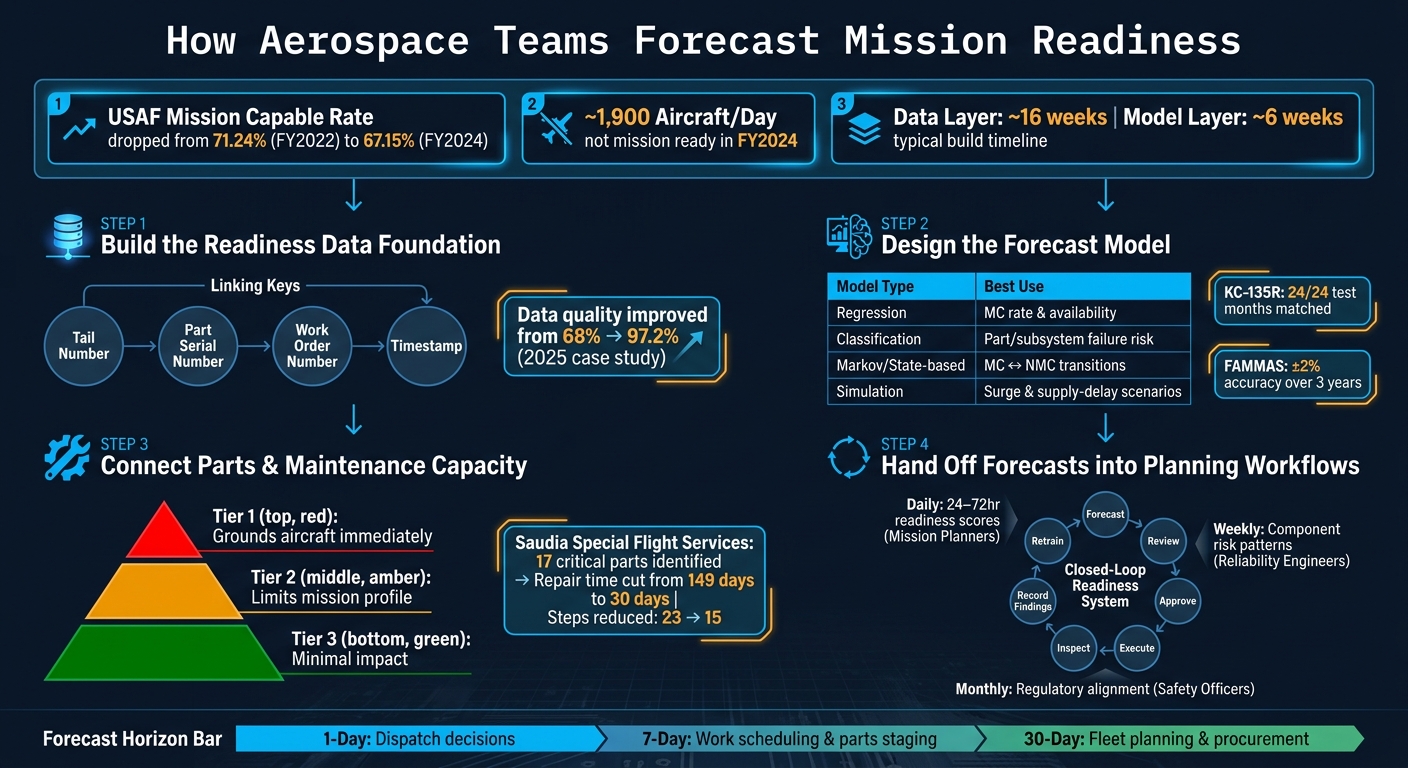
Mission readiness forecasts tell you one thing fast: which aircraft will be ready, when, and why not if they won’t be. That matters more now because USAF mission capable rate fell from 71.24% in FY2022 to 67.15% in FY2024, and about 1,900 aircraft per day were not ready in FY2024.
If I had to boil the article down, I’d say this: good readiness forecasting comes from linking aircraft data, maintenance data, parts data, and shop capacity into one forecast that people can use for 1-day, 7-day, and 30-day decisions. The model is only part of the job. You also need clean records, clear metrics like MC rate, TNMCM, and TNMCS, and a closed loop that sends forecast results into CMMS, ERP, and MRO tools.
Here’s the short version:
- Start with the decision. A 1-day forecast helps dispatch. A 7-day forecast helps schedule work and stage parts. A 30-day forecast helps fleet planning and buying.
- Use the same readiness metrics across teams. The main ones are mission capable rate, aircraft availability, TNMCM, TNMCS, deferred discrepancies, and abort rate.
- Build one joined dataset by tail number. Tie logs, inspections, parts, and work orders together with keys like tail number, part serial number, work order number, and timestamp.
- Turn records into forecast inputs. Use inspection age, repeat write-ups, deferred work hours, removals, flight tempo, stock levels, and even note text like “intermittent” or “overheat.”
- Pick the model based on the question. Regression fits availability and MC rate. Classification fits failure risk. State models fit MC/NMC shifts. Simulation fits surge and supply-delay cases.
- Don’t stop at the aircraft model. Parts shortages and shop backlog often decide whether a plane returns to service, so forecasts should include spares demand, lead times, and maintenance throughput.
- Push output into daily work. Readiness scores, risk flags, and draft work orders should feed the systems planners already use.
- Close the loop. Tag forecast-driven work, compare prediction vs. what happened, and retrain from those results.
A few numbers stand out. One aerospace case moved field data quality from 68% to 97.2%. A KC-135R study matched availability outcomes in 24 of 24 test months. And the Air Force’s FAMMAS method reached ±2% accuracy over three years for fleet MC rate.
So the big idea is simple: forecasting mission readiness is not just about failure prediction. It’s about whether parts, labor, inspections, and timing line up well enough for an aircraft to fly when needed.
Mission Readiness Forecasting: 4-Step Framework for Aerospace Teams
How military aviation uses AI to transform fleet readiness | Predictive maintenance with DataRobot
1. Build the readiness data foundation
Start with the data foundation. In aerospace, this part usually takes longer than building the model itself. The aim is simple: create one joined dataset for each tail number that connects maintenance, supply, and inspection events to readiness outcomes. In practice, the data layer often takes about 16 weeks, while the model takes about 6 weeks[1].
Inventory the core data sources and map them to tail number, part, and work order
Aerospace maintenance data is often scattered across PLM, ERP, quality systems, MES, and old files. The first job is to map each source and connect records across those systems.
The main linking keys are:
- tail number
- part serial number
- work order number
- timestamp
Each maintenance log entry, inspection record, and parts removal should trace back to those IDs. That traceability matters. If a record can’t be tied back to the right aircraft, part, or job, the forecast starts to drift.
Use APIs for ERP and PLM, CDC for inspection feeds, and OCR for scanned records and handwritten notes[1].
Clean, standardize, and structure data into forecast-ready tables
Before any modeling starts, set up automated quality checks and a shared data dictionary[1]. This keeps teams from arguing over what a field means or whether two systems are talking about the same thing.
The end product should be standardized, model-ready tables that planners can trust. Once those tables are clean and under control, you can use them to build forecast features from logs, inspections, and fleet operations.
Put governance and delivery controls around the data pipeline
In regulated aerospace settings, governance can’t be bolted on later. It needs to sit inside the pipeline from day one.
Apply ITAR/CUI classification, RBAC, and audit trails across the pipeline[1][3]. Log every data link and AI decision with the timestamp, user context, and rationale[3]. A medallion architecture - bronze, silver, gold - helps keep the pipeline controlled and usable[1][2].
This step has a direct payoff. In a 2025 aerospace case study, critical field data quality moved from 68% to 97.2%[1]. Once the pipeline is under control, those same tables can feed the forecast model.
2. Design the readiness forecast model
With the data base set, those forecast-ready tables become the model’s inputs and targets. The aim is simple: produce a forecast for a 1-day, 7-day, or 30-day horizon with a confidence range people can actually use.
Build features from logs, inspections, and fleet operations
Turn maintenance records into features like time since inspection, repeat discrepancies, component removals, deferred work hours, downtime by cause, sortie tempo, and stock versus safety stock. Add an exposure index for location, humidity, and temperature.
You can also use NLP on maintenance notes to flag repeat terms like “intermittent”, “chafing,” and “overheat,” then check those signals against NMC events. That step matters. A term that shows up often in notes but never lines up with downtime may just be noise.
Once the features are set, tie them directly to the forecast question: availability, failure risk, or state transition. If the question is fuzzy, the model output usually is too.
Choose the right model types for fleet readiness and component risk
Pick the model type that fits the decision at hand.
| Model type | Best use | Output |
|---|---|---|
| Regression | Aircraft availability or MC rate | Readiness estimate with confidence interval |
| Classification | Part or subsystem failure risk | Probability of failure within a defined window |
| Markov / state-based | Readiness transitions | Probabilities of moving between MC and NMC states |
| Simulation | Surge and supply-delay scenarios | Scenario-based fleet readiness distribution |
A KC-135R study showed regression matching availability outcomes in 24 out of 24 test months using personnel, environment, reliability, maintainability, funding, and logistics features [4]. For fleet-level MC rate, the Air Force FAMMAS approach achieved ±2% accuracy over three years using historical NMC and spares funding data [6][7].
For component risk, classification models give you a probability score that can roll up into the aircraft-level view. And when surge scenarios or supply disruptions start to shape the problem, Monte Carlo or discrete-event simulation helps planners pressure-test assumptions before they lock in a plan.
Validate forecasts against operational outcomes, not just model scores
A model only matters if it predicts operational readiness, not just past patterns. Start by comparing predicted versus actual MC rates across rolling weekly and monthly windows, broken out by tail number and unit. Track mean absolute error on the readiness percentage. Then check whether actual readiness lands inside the forecasted confidence interval as often as expected.
It also helps to review false alarms and missed degradations with maintenance and operations teams, not just data scientists. The real test is whether the forecast changes scheduling, parts ordering, and downtime decisions - not whether the score looks good on a dashboard.
3. Connect parts forecasting and maintenance capacity to readiness
A readiness forecast that leaves out parts and maintenance capacity will make availability look better than it is. Those two factors are what turn a component-risk forecast into a mission-capable probability you can actually use.
Once the aircraft-level model is in place, the next step is to add supply and maintenance limits. That’s where projected availability either becomes actual readiness or falls short.
Forecast spare parts demand for readiness-critical components
Not every part needs the same level of attention. Most teams start by finding readiness-critical components: parts whose failure can directly stop an aircraft from flying. Tier 1 parts ground the aircraft right away. Tier 2 parts limit the mission profile. Tier 3 parts have a smaller effect.
For each critical part, the main inputs are removals history, mean time between removals (MTBR), and past records showing whether the aircraft was waiting on parts. Say a hydraulic pump is removed 5 times over 25,000 flight hours. Its MTBR is 5,000 hours. Over 50,000 hours, you’d expect about 10 removals [11][13]. That gives planners a simple way to set reorder points and safety stock.
Intermittent demand is where things get tricky. Rare failures can make plain averaging models fall apart. Work on aviation spare parts uses the average inter-demand interval (ADI) and coefficient of variation to sort demand patterns, then applies models such as Croston-type methods for low-volume, high-criticality items [14]. The result is a service-level stock policy. For instance, if the goal is a 90% in-stock probability for the spare part most often tied to an aircraft-on-ground (AOG) event, the model shows that 4 units should be held in stock [9].
A case study from Saudia’s Special Flight Services shows how much a narrow parts effort can change outcomes. The team identified 17 critical parts, made a small stock increase, and cut the repair process from 23 steps to 15. Average repair turnaround dropped from 149 days to 30 days, AOG occurrences went down, and downtime fell to acceptable levels [8]. That’s the key idea: focus on a small group of high-impact parts instead of stuffing the whole catalog with more inventory.
Of course, parts forecasts only help if maintenance has enough room to handle the work that follows.
Model how parts delays and maintenance backlog reduce aircraft availability
An aircraft goes back into service only when everything lines up: parts, labor, tooling, inspections, and approvals. On paper, a shop may have enough capacity. In practice, actual throughput can be much lower.
This is where event-driven simulation and queue models help. For aircraft awaiting parts, failure events are pulled from demand forecasts, lead-time distributions are sampled with Monte Carlo methods, and the model then estimates daily fleet availability, plus TNMCS and TNMCM hours by tail number. That gives planners a way to test what-if cases like longer supplier lead times or lower spare levels. It also helps separate parts shortages from maintenance backlog by tracking TNMCM, TNMCS, and mission capable rates [5][10][12].
Those outputs then feed scheduling, work orders, and inspection planning.
4. Hand off forecast output into planning and maintenance workflows
Once the forecast is built, it needs to move into planning and maintenance work. A readiness forecast only matters when it changes what people do.
Feed forecast outputs into CMMS, ERP, and MRO systems
The most practical setup creates daily readiness scores for each tail number, such as a 0–100 readiness score, along with risk flags for critical components like “high risk in the next 30 flight hours.” Those outputs should flow into the systems planners already use: CMMS, ERP, or aviation MRO platforms.
From there, the output should kick off work orders, inspection changes, and schedule updates. If a component’s predicted failure probability passes a set threshold, the system can generate a draft work order with suggested tasks, parts lists, and a recommended maintenance window. That saves planners from having to turn a risk score into an action item by hand.
The same logic can reprioritize inspections before fixed intervals arrive. Aircraft with rising risk, or components getting close to predicted thresholds, move into the next inspection slot. Weekly outputs can also help balance bay space, labor, and parts capacity, so planners can compare projected workload with available resources before work turns urgent.
Build a closed-loop process from forecast to action to model improvement
Use this loop: forecast → review → approve → execute → inspect → record findings → retrain. Each step needs a named owner and a set cadence. Mission planners should review the next 24–72 hours of readiness scores each day. Reliability engineers should look at component-level risk patterns each week. Safety and compliance officers should review how forecast-driven actions line up with regulatory requirements each month.
NASA’s Reliability-Centered Maintenance guidance emphasizes that maintenance experience and equipment-condition data should be fed back to planners and managers to continually improve reliability. [15]
In day-to-day use, every forecast-driven work order should be tagged in the CMMS as “forecast-initiated.” It should also include fields for whether a fault was actually found, what parts were used, and how long the aircraft stayed out of service. Those results should link back to the original forecast snapshot so the AI team can compare predicted risk with what happened in operations and retrain the model on the expanded dataset.
Keep the loop traceable with logging, validation, and governance. That feedback helps keep the next forecast tied to actual maintenance results.
Conclusion: The practical path to a usable mission readiness forecast
A usable readiness forecast starts with a clear definition of readiness, clean data, and a model linked to day-to-day operational decisions. But that groundwork means little unless the forecast actually shapes planning and maintenance choices.
The model only earns its place when it can predict operational outcomes and plug into the tools planners already use. Once the forecast is live, the work doesn’t stop. The process needs to run as a loop: forecast, act, record, retrain.
Ryshe helps aerospace teams build the data foundations, integrations, and AI systems behind production readiness forecasting.
FAQs
What data do teams need first?
Teams need a governed data foundation before they build models.
That starts with inventorying data systems, mapping data flows, and creating a data dictionary so departments use the same definitions. If one team defines a metric one way and another team defines it differently, the model will inherit that confusion.
They also need access to engineering data, production logs, ERP transactions, and sensor data. And before any modeling starts, the data has to be clean, easy to access, and checked with automated quality controls.
How do parts shortages affect readiness forecasts?
Parts shortages throw off forecast accuracy because they create a gap between planned maintenance and what’s actually sitting in inventory. That means forecasting models need to factor in missing components so teams can make a more realistic call on when an aircraft can return to service.
When teams combine inventory data with supplier lead-time trends, they can spot potential stockouts early. From there, they can adjust workflows, prioritize critical repairs, and cut down on emergency expediting or messy manual spreadsheet workarounds.
How are forecasts used in daily maintenance planning?
Forecasts turn predictive alerts into work orders your team can act on. When a model spots a likely failure, the system lines up the predicted timing with the current production schedule to see how much the issue could disrupt operations.
From there, it handles the coordination work that usually eats up time. It checks whether parts are in stock, identifies technicians with the right skills, finds the best maintenance window, and creates a work order that includes procedures, parts, and safety requirements.
That cuts down on manual back-and-forth. It also gives future models better data by logging what happened after the work was done.